Torek Fuel consumption analysis
Updated
Fuel consumption analysis and trip analytics: actual, norm and variances
Fuel consumption analysis is the comparison of each vehicle’s actual consumption with its norm: how many litres it burns per 100 km, what the variance is in per cent, and why. Without that comparison, fuel costs are just a total on an invoice.
Torek calculates actual consumption between two full fill-ups from odometer or engine-hour readings, compares it with the norm and flags suspicious fill-ups. Trip-log statistics show the other side: kilometres, driving and idle time, business and private trips — by vehicle, driver and day.
Fuel summary: the whole fleet on one screen
At the top, the figures for the selected period; below, how they changed month by month and which vehicles stray furthest from the norm.
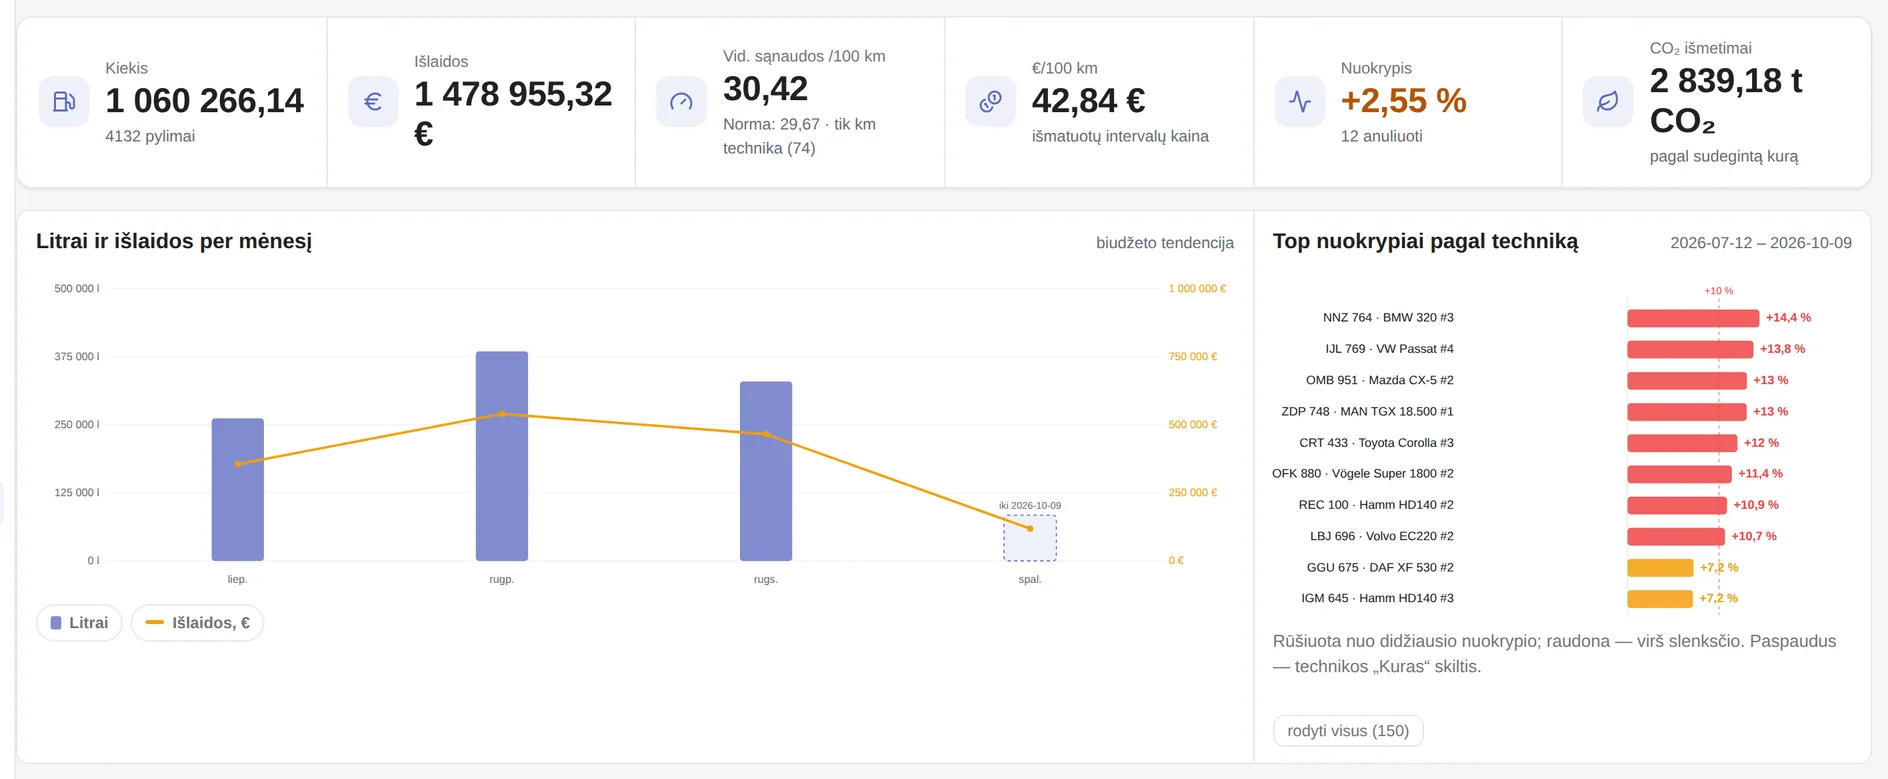
Screens are shown in Lithuanian; the interface is also available in English.
- Average consumption and norm. Actual l/100 km is shown next to the norm, so it is immediately visible whether the fleet burns more than it should.
- €/100 km. What it costs to drive 100 km — calculated only from measured intervals.
- Variance. The fleet’s overall variance from the norm in per cent, and how many fill-ups were voided as erroneous.
- CO₂. Emissions in tonnes from the fuel burned (2.68 kg per litre of diesel, 2.31 kg for petrol); the factors can be changed.
- Monthly trend. Litres and costs per month in one chart — the budget change is visible without a spreadsheet.
What +2.55% means. In the demo fleet that is about €37,000 burned above the norm over 90 days, out of €1.48 million in fuel costs. That figure is not on any invoice — it only appears once actual consumption is compared with the norm.
How actual consumption is calculated
Actual consumption is calculated between two full fill-ups: how far the vehicle drove between them and how much fuel was filled. Litres from partial fill-ups are added to the nearest full interval, so not a single litre goes missing.
For machinery that works in engine hours, litres per engine hour are calculated on the same principle.
Fill-ups that would distort the average are voided automatically: a decreasing odometer, more fuel filled than the tank holds, consumption more than three times the norm. They stay in the list but are left out of the calculation; if the system got it wrong, a manager reverses the void. A possible duplicate is shown while the entry is still being typed, and it can only be saved after confirmation.
One vehicle’s fuel alongside its repairs
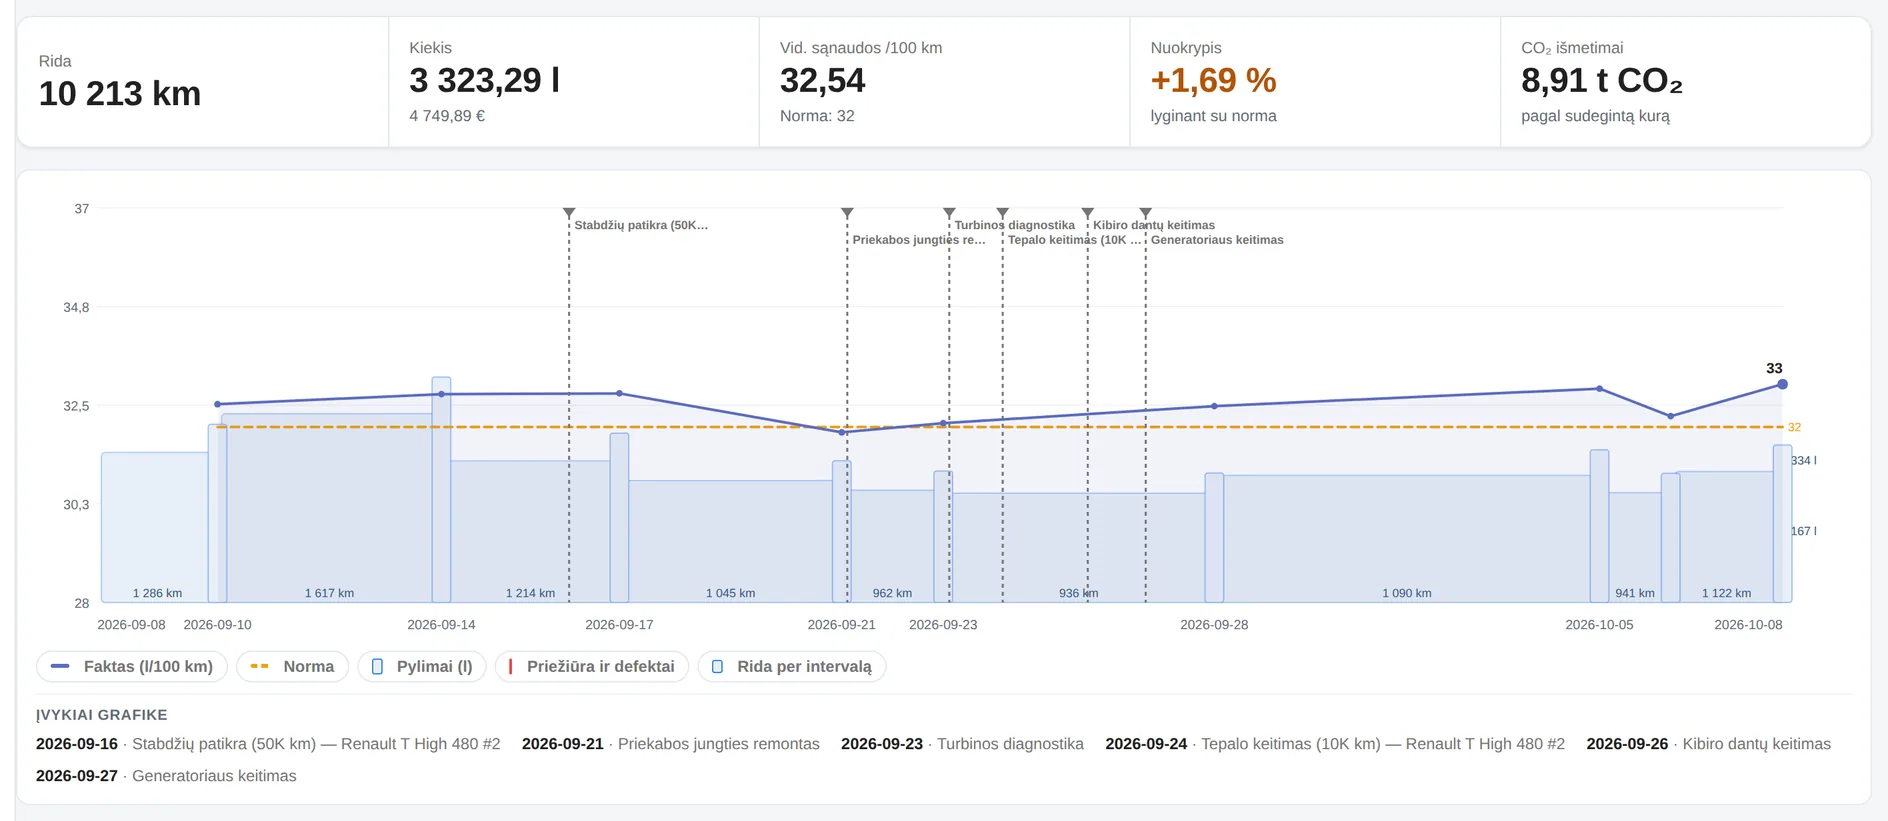
Opening a vehicle shows the actual, the norm, the fill-ups and the kilometres for every interval. Maintenance jobs and defects are marked on the same timeline, so you can check whether consumption changed after a filter change or a tyre or brake repair.
Suspicious fill-ups: the review queue
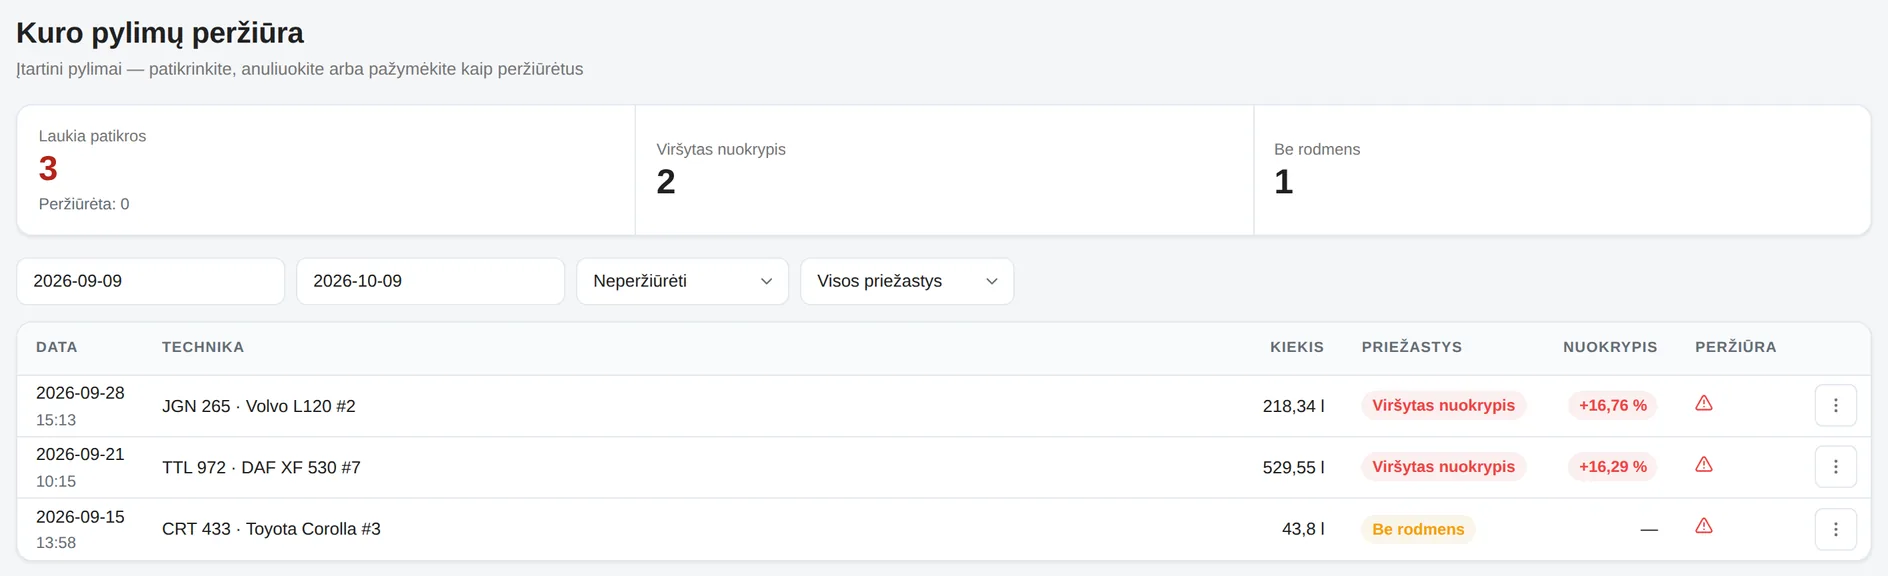
A manager does not need to go through every fill-up — the system collects only the ones worth checking and shows the reason. An entry can be voided or marked as reviewed with a note. If the queue holds unreviewed fill-ups, managers get a summary by email on Monday morning.
| Reason | What it usually means |
|---|---|
| Variance exceeded | Actual exceeds the norm by more than the configured limit (10% by default): a tank that was not full, an input error or a technical problem |
| No meter reading | A fill-up without an odometer reading — the interval cannot be measured |
| Decreasing odometer | The reading is lower than the previous one — a typing error |
| Exceeds tank capacity | More fuel filled than the tank holds — the fill-up went to the wrong vehicle, or two receipts were merged |
| Implausible consumption | More than three times the norm — usually an error in the reading or the quantity |
| Duplicate | The same vehicle filled twice within 10 minutes, or the same receipt uploaded a second time |
| No driver | It is unclear who filled up (checked if the company turns this on) |
Trip analytics from trip logs
Trip logs provide what fuel entries cannot: who drove, how much time was spent on the road and how much standing still, and what share of the trips was business. For a short period the chart shows every day; for a longer one — weeks.
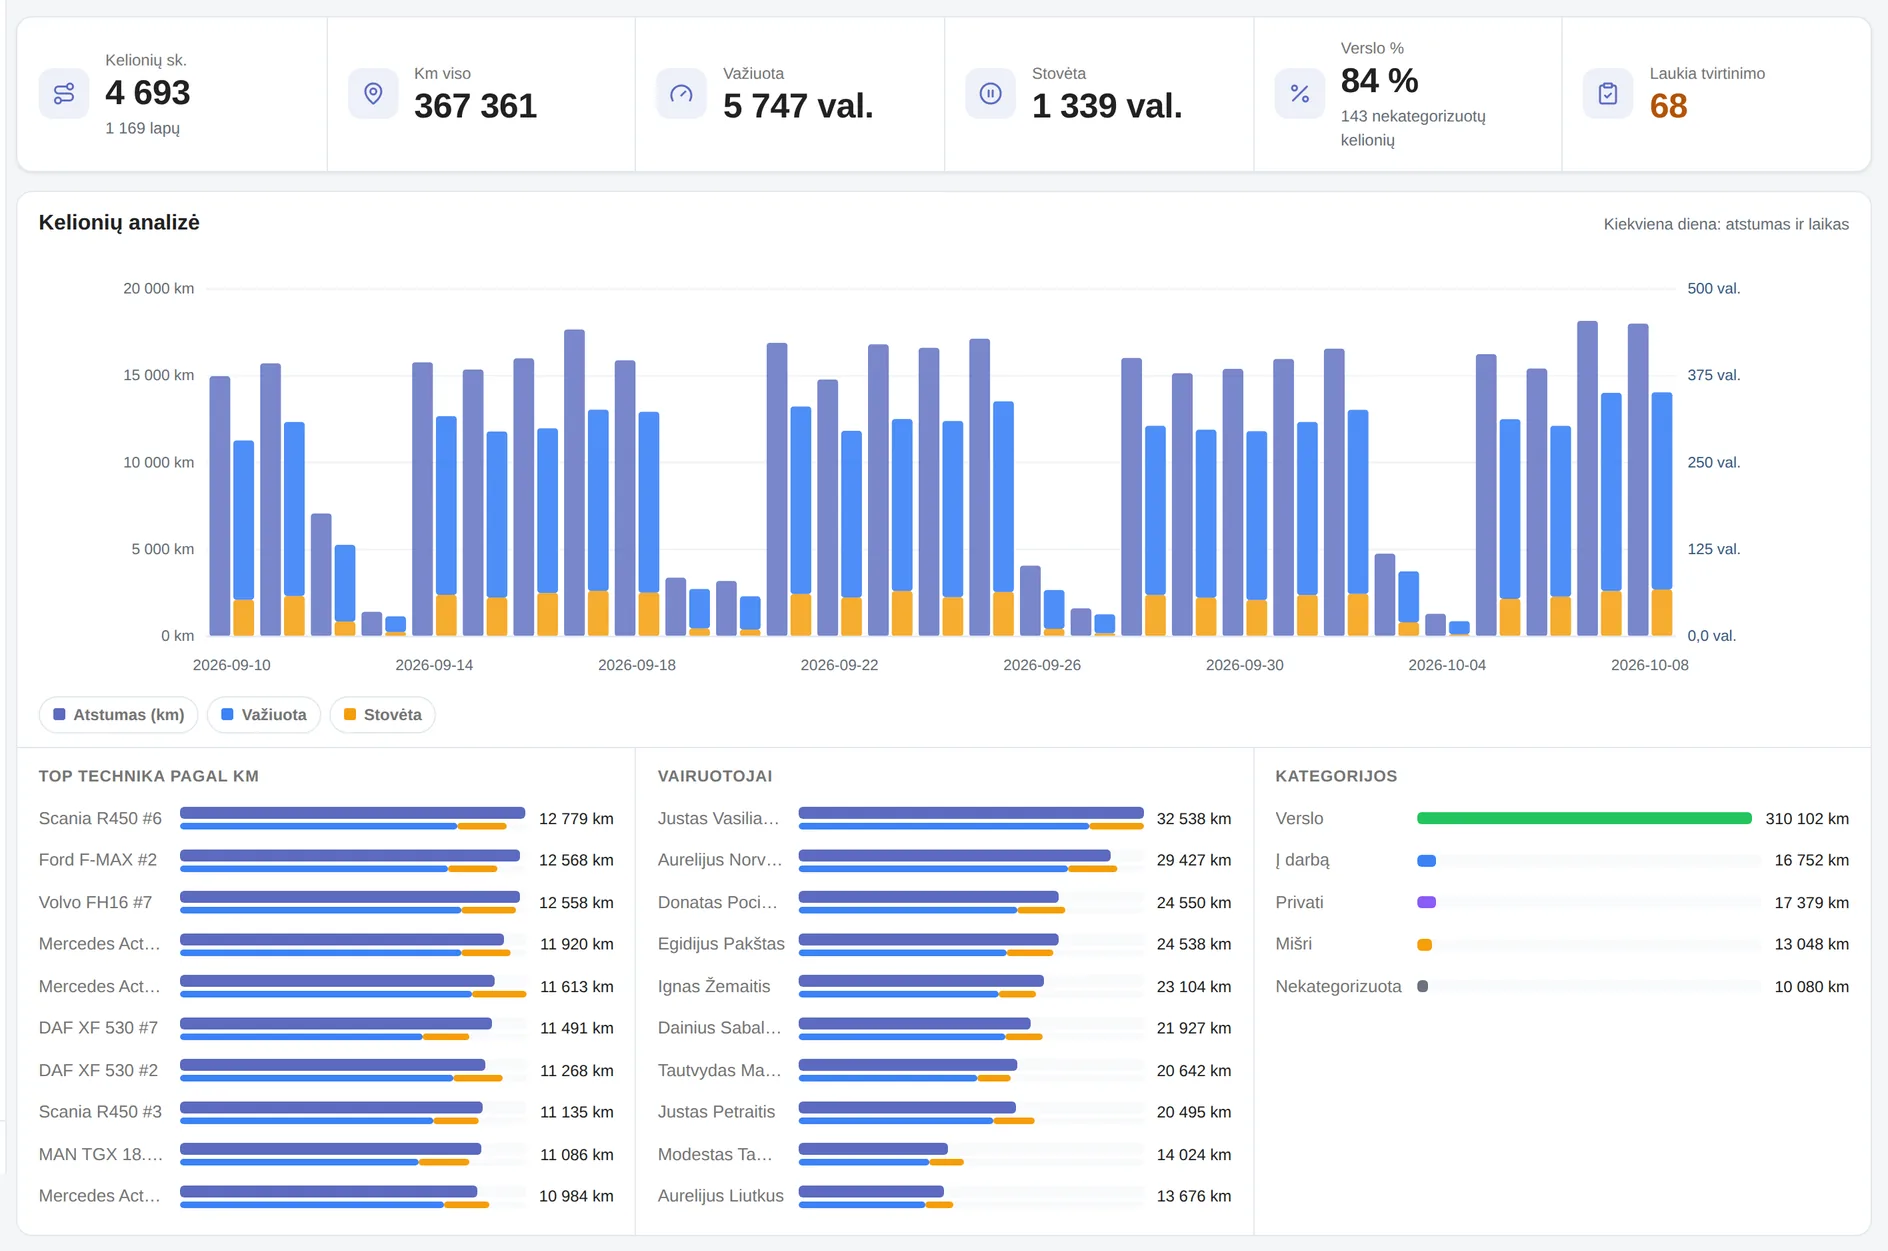
- Driving and idle time. A lot of idle time usually means waiting at loading points or an inefficient route.
- Business share. What share of the distance is made up of business trips; commutes and mixed trips are not counted towards it. Kilometres by category and trips without a category are shown separately.
- Vehicles and drivers. The ten vehicles and drivers with the most kilometres; hovering also shows time and average speed, clicking opens their logs.
- Awaiting approval. How many submitted logs are not yet approved; clicking leaves only those.
How drivers fill in the logs is shown on the page about trip logs on the phone.
Where to find the answer
| Question | Where to look |
|---|---|
| Which vehicle burns more than the norm? | Fuel summary → largest variances |
| Did consumption change after a repair? | The vehicle’s fuel chart with maintenance events |
| Which fill-ups look wrong? | Review queue |
| How far was driven for private purposes? | Trip analytics → categories |
| Who spends the most time standing still? | Trip analytics → driving and idle time |
Reports for the manager and accounting
- Fuel write-off act. A monthly PDF — for one vehicle or for the whole fleet: odometer at the start and end of the month, the norm in force, actual consumption, consumption by norm and the variance, a table of fill-ups, a driver summary and CO₂.
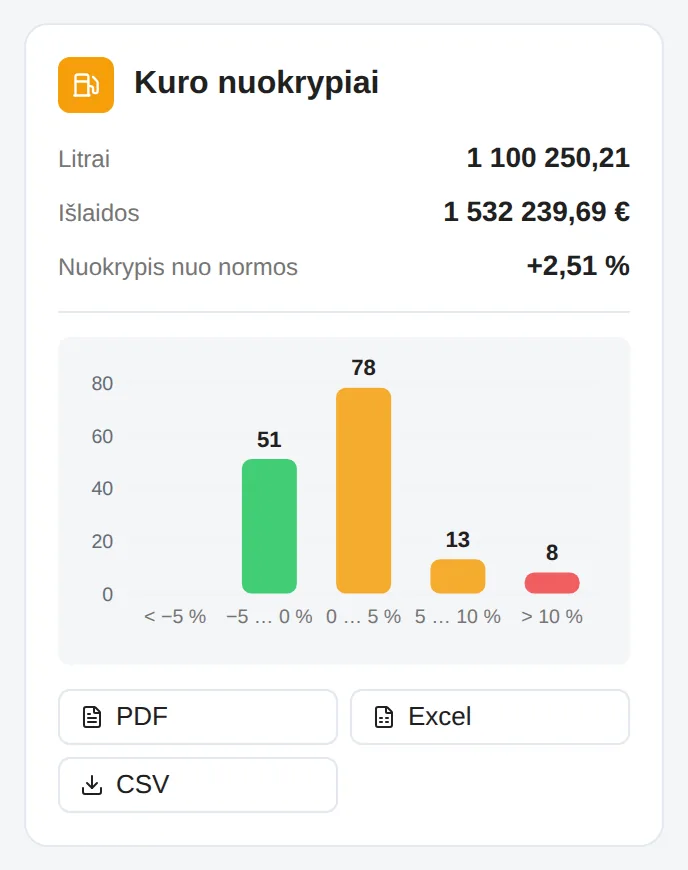
- Fuel variance report. Litres, costs, variance from the norm and the distribution of variances; exports to PDF, Excel or CSV.
- Trip logs. Numbered and approved logs with categories. There is currently no export to accounting software — if you need one, tell us during the demo.
Where the data comes from
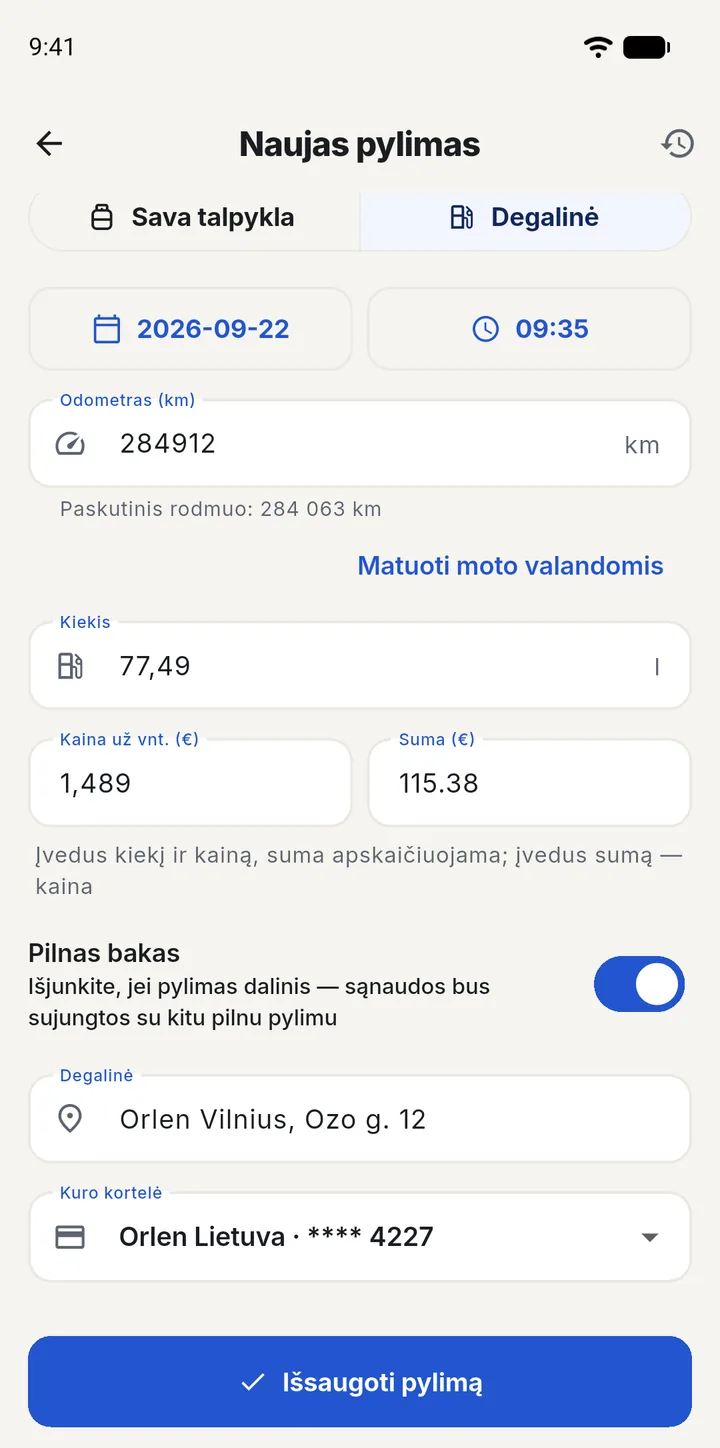
The driver’s phone. The fill-up is entered in the app, offline too: odometer or engine hours, quantity, price, full tank or not, fuel card. The app shows the last known reading, so a typing error is easy to spot.
Fuel card statements. A CSV file from the provider’s self-service portal: Circle K, Neste, Viada and Orlen layouts are recognised, and the vehicle is matched by registration number or by card. Before saving, it shows how many rows, litres and euros will be imported.
Own fuel tank. If fuel is drawn from the company’s own tank, the system keeps its balance (measurements, deliveries, fill-ups) and assigns the fill-up the price of the latest delivery.
How norms are set and how all of fuel tracking is handled is described separately: fuel tracking.
What is not here: data is not taken from the vehicle’s on-board computer or GPS hardware, fuel-station systems are not connected directly, and photographed receipts are not recognised. Actual fuel consumption is calculated from fill-ups and their readings — trip-log kilometres do not change it, and the fuel and trip figures are shown on separate screens.
Frequently asked questions
How do you calculate fuel consumption per 100 km?
Litres filled are divided by kilometres driven and multiplied by 100. For an accurate result the calculation runs between two full tanks: all litres filled from one full fill-up to the next are added up, and the kilometres come from the odometer readings at those fill-ups.
Example: 1,075 km driven between full fill-ups and 350 l filled. 350 ÷ 1,075 × 100 = 32.6 l/100 km.
Why is consumption calculated only between full fill-ups?
If the tank is not filled to the top, the litres filled do not show how much fuel was burned since the previous fill-up. Between two full tanks exactly as much was burned as was filled, so only that interval gives a reliable figure. Litres from partial fill-ups are not lost — they are added to the nearest full interval.
What counts as a fuel variance?
A variance is the difference between actual consumption and the norm, in per cent. If the norm is 32 l/100 km and the actual is 32.6 l/100 km, the variance is +1.8%.
A single large variance usually means an input error or a tank that was not full. A steadily growing variance is a technical signal: filters, tyre pressure, injectors, brakes.
What is the difference between l/100 km and €/100 km?
l/100 km shows how much a vehicle burns and is the right figure to compare with the norm. €/100 km shows what it costs to drive 100 km, so it also depends on the fuel price. When prices rise, €/100 km goes up even when the vehicle burns exactly as much as before.
Does trip analytics need GPS?
No. Kilometres, time and categories come from the trip logs that drivers fill in on the phone, and fuel comes from fill-ups and card statements. No hardware needs to be installed.
Is a different norm applied in winter?
A norm can be given a season: winter runs from November to March, summer covers the remaining months. A norm is set for a specific vehicle or for a whole equipment type, and a coefficient adjusts it — for example when a vehicle works with a trailer.
Do past figures change when a norm is changed?
No. Norms are versioned: when a norm is changed, the old one is closed rather than overwritten. Variances for past months stay as they were calculated under the norm in force at the time.
See your own fleet’s fuel and trip figures
A 30-minute demo: fuel summary, variances and trip analytics with an example from your own equipment.
Get in touch